
Swimming to Shore: Troubleshooting EPM Cloud Data Integration from Kscope26

At this year’s ODTUG Kscope26 conference in Denver, EPMI Solutions Architect Chian Lin walked through a comprehensive, repeatable methodology for troubleshooting EPM Cloud Data Integration errors: reading the log, isolating the issue, researching the fix, and resolving errors with confidence.
How to Troubleshoot Cloud EPM Data Integration the Right Way
Most EPM training teaches you how to build. What nobody covers is what to do when it’s 4:55 pm, the load failed, close is in 18 hours, and the log is 1,247 lines long.
Troubleshooting gets passed down the hard way, from the senior on the team to whoever gets pulled in next, one painful close cycle at a time. You need to know how to fix.
The good news is: you can’t memorize every error code, but you can master a repeatable process that helps troubleshoot any failure, including ones you’ve never seen before.
What Is EPM Cloud Data Integration?
EPM Data Integration is the engine that moves data from your source systems, including GL, ERP, flat files, and on-prem databases, through a transformation layer and into your target EPM application.
The transformation step is where the real work happens. Raw source values rarely match the target directly, so Data Integration maps source codes to target members, translates periods, and filters rows before a single cell gets written. Once that translation is done, the data lands in its destination: a Planning, Freeform, Financial Consolidation and Close, or Profitability and Cost Management cube.

A failure anywhere in that process means your cube ends up with missing or stale data.
What Almost Every Data Integration Failure Has in Common
Almost every Data Integration failure falls into one of three buckets:
1. Bad source data: The integration ran fine, but the data itself failed validation. A new account code was added, an entity is missing, a period is closed, or a member doesn’t exist in the target.
- Common messages: “member not found,” “no rule defined,” “period locked.”
2. Bad setup: Something changed in the integration definition itself. A dimension mapping is wrong, the file format broke, security is missing, or credentials expired.
- Common messages: “unauthorized,” “format mismatch,” “dimension required.”
3. Oracle / infrastructure: The pod itself is unhealthy, a patch broke something, or the on-prem agent disconnected.
- Common messages: “500 internal error,” “service unavailable,” “agent timeout.”
The critical takeaway: roughly 85% of failures are Bucket 1 or 2. Bucket 3 is rare and goes straight to an Support Request.
The Troubleshooter’s Methodology: Four Steps For Any Data Integration Failure
Troubleshooting a failed EPM Data Integration works in these four steps:
- Read: Skim the log top to bottom
- Isolate: Find the real error in the noise
- Research: Search smart. Use the knowledge base and community.
- Resolve: Apply the fix. Document it

STEP 1: Read
Before you can fix anything, you need to understand what the log is actually telling you. Search for keywords from top to bottom; every line tells you where you are in the journey.
Every data load runs through three stages in sequence. Start by identifying which stage failed.
The Three Stages:
- Import: File or source data moves into a temporary staging table (TDATASEG). No transformations yet. Common failures: file not found, encoding mismatch, header row drift, EPM Integration Agent down.
- Validate: Every source value maps to a valid target member. Unmapped rows are flagged. Common failures: source value with no mapping rule, null values in source data, new source members after a metadata refresh, case sensitivity issues.
- Export: Mapped data pushes into the target EPM application. Common failures: invalid intersection in target cube, locked period, read-only or dynamic-calc target member, insufficient data security.
Where to Find the Log:
- Process Details (primary): Each row is one execution. Click a row to see Status, Log Level, and the Show Log link.
- Workbench: Best for Validate-stage failures. Shows exactly which rows failed and why.
- Downloaded Log: Full server-side .log file. Best for Import and Export failures with full Java stack traces.
- Job Console: End-to-end view across rules and batch jobs.
Controlling Log Detail with Log Level:
When the default log isn’t giving enough information, Log Level determines how much the engine writes. Set it under Setup → System Settings → Log Level.

STEP 2: Isolate
You’re not trying to understand the whole log. This is where you narrow down: find one sentence, the first error in time order, that you could paste into a search engine.
Keywords that signal the real error:
- FATAL: Highest severity. Process aborted. Almost always the originating cause.
- ERROR: Can be cause or symptom. Always find the first one in time order, not the last.
- Caused by: Java’s pointer to root cause. Scroll down the stack to the deepest Caused by entry.
rejected — Essbase/cube-side rejection. Pinpoints export-stage member or security issues. - Process status: FAILED: The exit line. Useful as a starting anchor; search backwards from here
Signal vs. Noise
Noise (Ignore at first):
- Long Java reflection stack traces (sun.reflect, jdk.internal)
- Repeated NullPointerException at the top of the stack
- INFO lines about kicked-off subjobs
- WARNINGs in unrelated dimensions
- ‘Cleanup failed’ messages AFTER the real failure
Signal (Focus here):
- FIRST error in time order — the originating failure
- Deepest Caused by: clause in a stack trace
- Specific values in quotes: ‘ACCT-8845’, ‘/inbox/…’
- Words that name a real artifact: rule, dimension, member, period
- The line immediately BEFORE ‘Process status: FAILED’
For Validate Failures: Use the Workbench
Filter by Validation Status = FAILED. The Workbench shows the exact rows and the exact dimension that needs a mapping rule. Click a failed row → Modify Mapping → fix in place → re-validate without rerunning the full load.
For Export Failures: Use Smart View
If the log names an invalid intersection but doesn’t explain why the cube rejected it, connect to the target in Smart View and attempt a manual retrieve at that intersection. Common errors from the cube:
- #Missing — Intersection valid but empty. Likely a security or POV issue.
- #Invalid Member — Error 3303. Member not in outline or not enabled for this plan type.
- #No Access — Member exists, but load user lacks write security.
- #Read Only — Dynamic-calc, label-only, or stored-with-formula — can’t be loaded directly.


STEP 3: Research
The difference between finding an answer in five minutes versus an afternoon is research technique.
Four habits to step up your research skills and troubleshoot faster:
- Paste the error verbatim: Copy the exact error string in quotes, including punctuation, capitalization, and member names. Search engines reward precision.
- Remove your specifics: Strip out your timestamps, member names, and file paths. Search the structural part of the error that’s true for everyone hitting it.
- Check three sources every time: My Oracle Support → Customer Connect → EPM blogs and Google. Each surfaces different threads. One source is luck; three is a system.
- Filter by date and version: A 2018 fix may not apply to a 2026 pod. EPM Cloud changes. Old answers can lead you the wrong direction.
Where to Look: In Priority Order
- My Oracle Support: Search the KB with the exact error in quotes. Filter to Oracle EPM Cloud. Sort by Updated. Read: Symptom → Cause → Solution → See Also.
- Customer Connect: Real EPM admins solving real problems. Faster on edge cases than the KB, and free.
- EPM Blogs and Google: Long-form, screenshot-driven walkthroughs. Filter by recency. Community Slack and LinkedIn groups here too.
- ODTUG / KScope: Conference presentations are searchable year-round.
Log an Effective Oracle Support Request
When:
- You’ve ruled out Bucket 1 (bad data) and Bucket 2 (bad config)
- The error is clearly platform or pod-level (500, gateway, agent infrastructure)
- Behavior changed after a monthly Oracle patch
- A KB article explicitly says to log an SR to enable something
- Close is at risk and you need Oracle eyes now
What to include:
- Pod name + environment (test/prod) + date/time of failure (with TZ)
- Process ID from Process Details
- Full downloaded log (not a screenshot of part of it)
- Steps to reproduce — exactly what you did
- What you’ve already tried (KBs read, fixes attempted)
STEP 4: Resolve
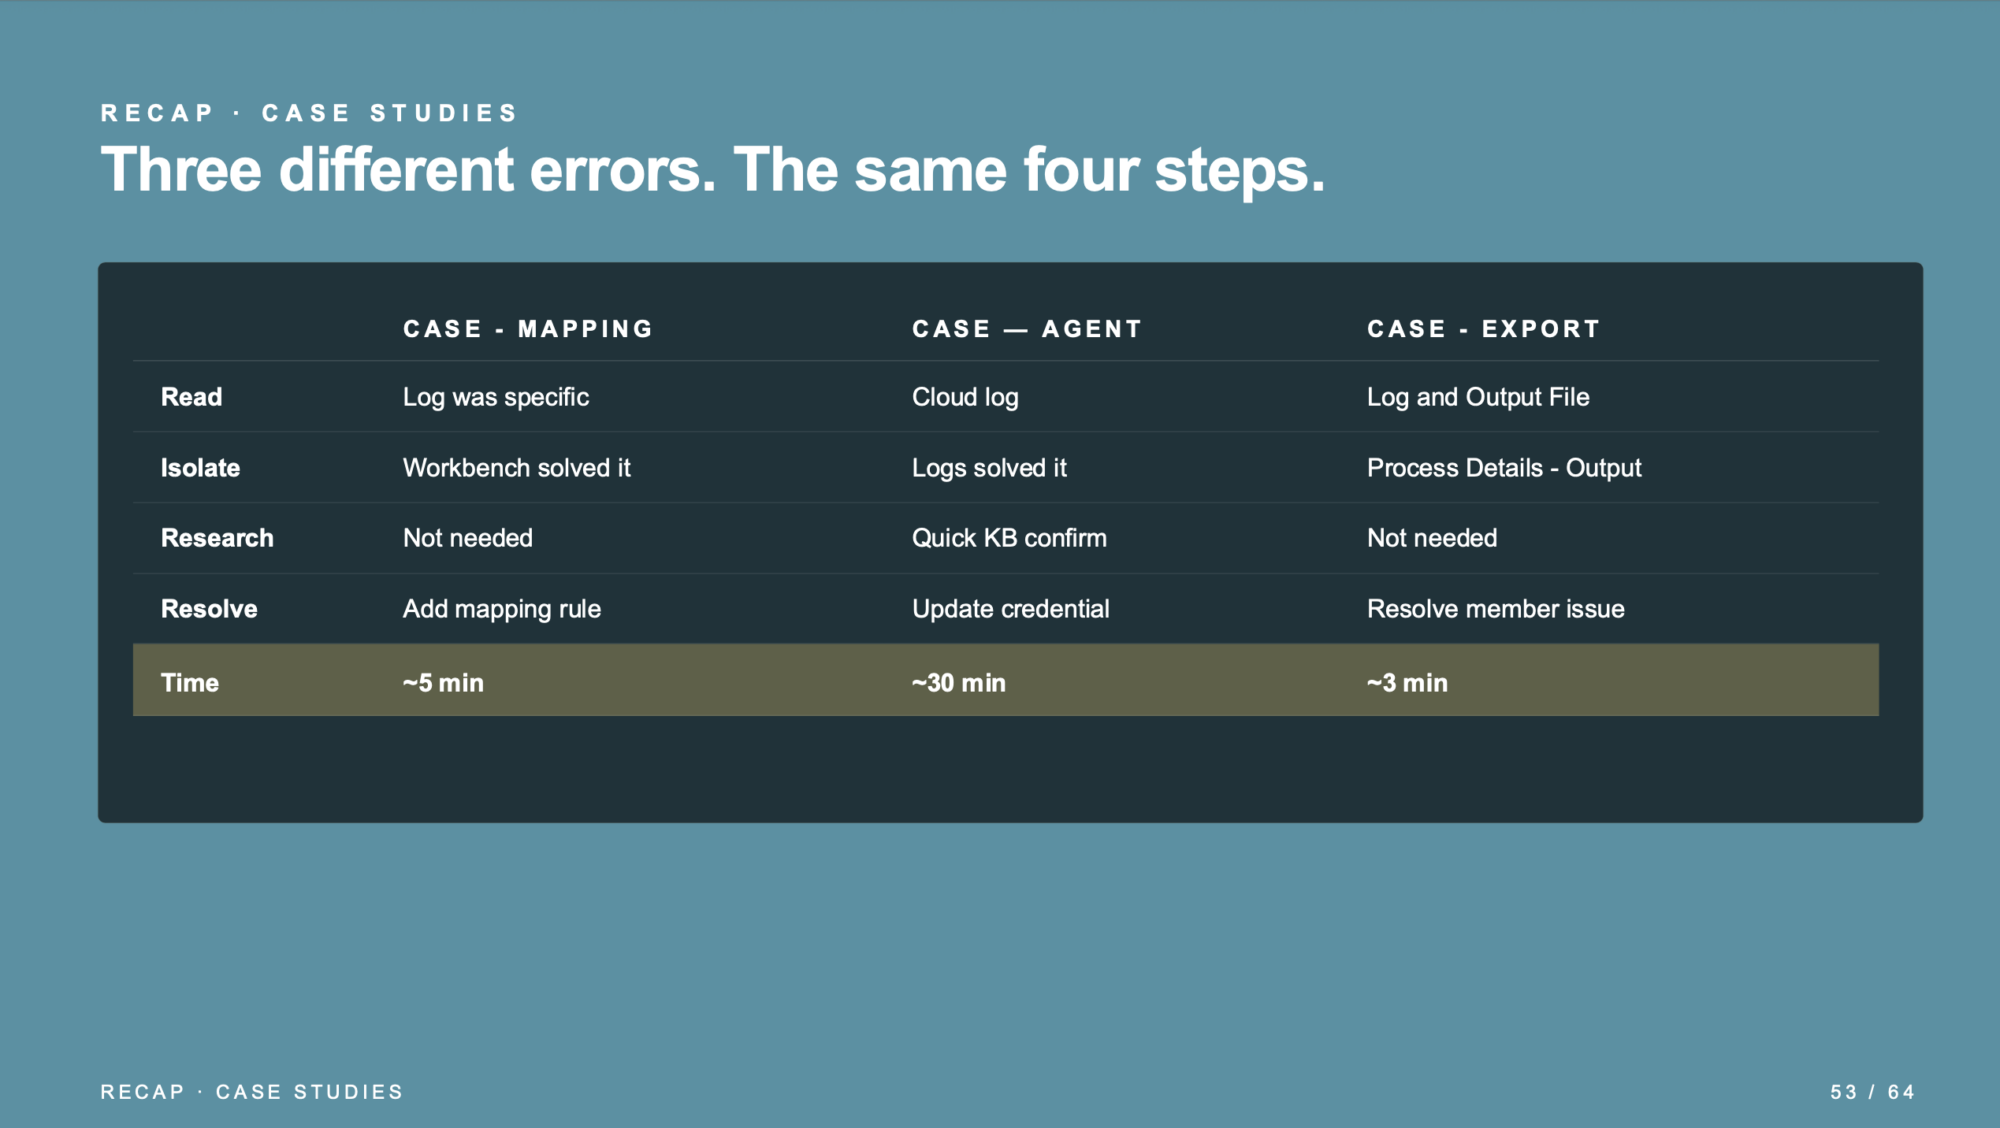
Resolve is where the methodology pays off. Once you know what broke and why, the fix is usually straightforward. Apply it, re-run, and verify it held. The case studies below show three completely different failure types.
Case Study 1: The Mapping Failure
Scenario: A monthly trial-balance load that had been stable for months ran red. Import succeeded with 24,318 rows. Validate failed.
What the log said: No mapping for ACCOUNT=’8845-X’. Two rows affected.
What happened: A new GL account was added that period. No mapping rule existed for it yet.
Resolution: Open Workbench, filter to Failed, confirm both rows share the same source value, verify it’s a valid new account, add a LIKE-rule mapping, re-run from Validate. Total time: ~8 minutes.
Case Study 2: The EPM Integration Agent Credential Failure
Scenario: A daily on-prem GL extract via EPM Integration Agent failed in eight seconds. The cloud-side log showed a generic connection stack trace — no source values, no mapping issues, nothing obvious.
What made this harder: The Integration Agent runs outside the Oracle pod. There are two logs: one on the cloud side, one on the on-prem agent host. The Workbench was empty — no transactional data had made it through at all.
What the agent-side log said: ORA-01017: invalid username/password. The service account password had been rotated overnight by the infrastructure team.
Resolution: Update the stored credential in the agent config, re-encrypt with the agent’s encryption utility, restart the EPM Integration Agent Windows service, re-run end to end. Add password rotation to the runbook with an alert before expiry. Total time: ~25 minutes.
Case Study 3: The Platform Error
Scenario: A load failed in four seconds with nothing actionable in the log. Reproducing with a smaller dataset failed identically. Testing a different integration also failed.
What research surfaced: No incident on Oracle’s Cloud Status page, but two other customers on Customer Connect are reporting the same issue since 3 am UTC.
Resolution: Open a Sev-1 SR with pod name, process IDs, empty log screenshot, and links to the supporting Customer Connect threads. The methodology got to the right answer — log a great SR — faster than trial and error would have. Even when the answer is “call Oracle,” the four steps get you there with the evidence Oracle needs.
Eight Habits of Effective EPM Troubleshooters
The methodology is the framework. These eight habits are what make it stick in practice.
1. View Process Details and skim the log top to bottom — at least once
2. Identify the failed stage before anything else
3. Use Workbench for Validate failures; use the downloaded log for Import and Export
4. Search past the symptom — find the first error in time order
5. Quote literal error strings and add product context to your search
6. Bump log level for hard cases — reset it afterward
7. Document every fix in a runbook
8. Keep a small test integration ready for safe re-runs
FAQ: Troubleshooting EPM Data Integration Failures
Does this methodology work if I’m new to EPM Data Integration?
Yes. The framework is designed to be repeatable regardless of experience level. You do not need to know every error code or understand every line of a Java stack trace. You need to know where to look, what to search for, and in what order. That is what the four steps give you.
What if the error isn’t in any KB article or Customer Connect thread?
Start by checking both logs: the cloud-side Process Details log and, if you are using the EPM Integration Agent, the agent-side log on the on-prem host. Errors that look cryptic on the cloud side often have a plain-language explanation in the agent log. If you have checked both and still cannot find the answer, that is when you log a well-documented SR.
How do I know if it’s my config or Oracle’s platform?
Try to reproduce the failure with a smaller dataset or a different integration. If the same error appears regardless of what data you use or which integration you run, and you have already verified your mappings and credentials are correct, the evidence is pointing to the platform. Check Oracle’s Cloud Status page and Customer Connect before logging an SR
Do I really need a runbook if I can just search for the fix again next time?
Yes. The search will take the same amount of time every time. A runbook entry turns a 25-minute problem into a five-minute one. It also means the fix does not walk out the door when the person who found it moves on to another role.